#charts
Read more stories on Hashnode
Articles with this tag
We are pleased to share a helpful article we've found on EODHD APIs, where Michael Whittle, a seasoned developer and top Medium author, shows how he...
Ever caught yourself thinking about the Roman Empire more often than you’d like to admit? You’re not alone, and we’ve got just the thing for you! With...
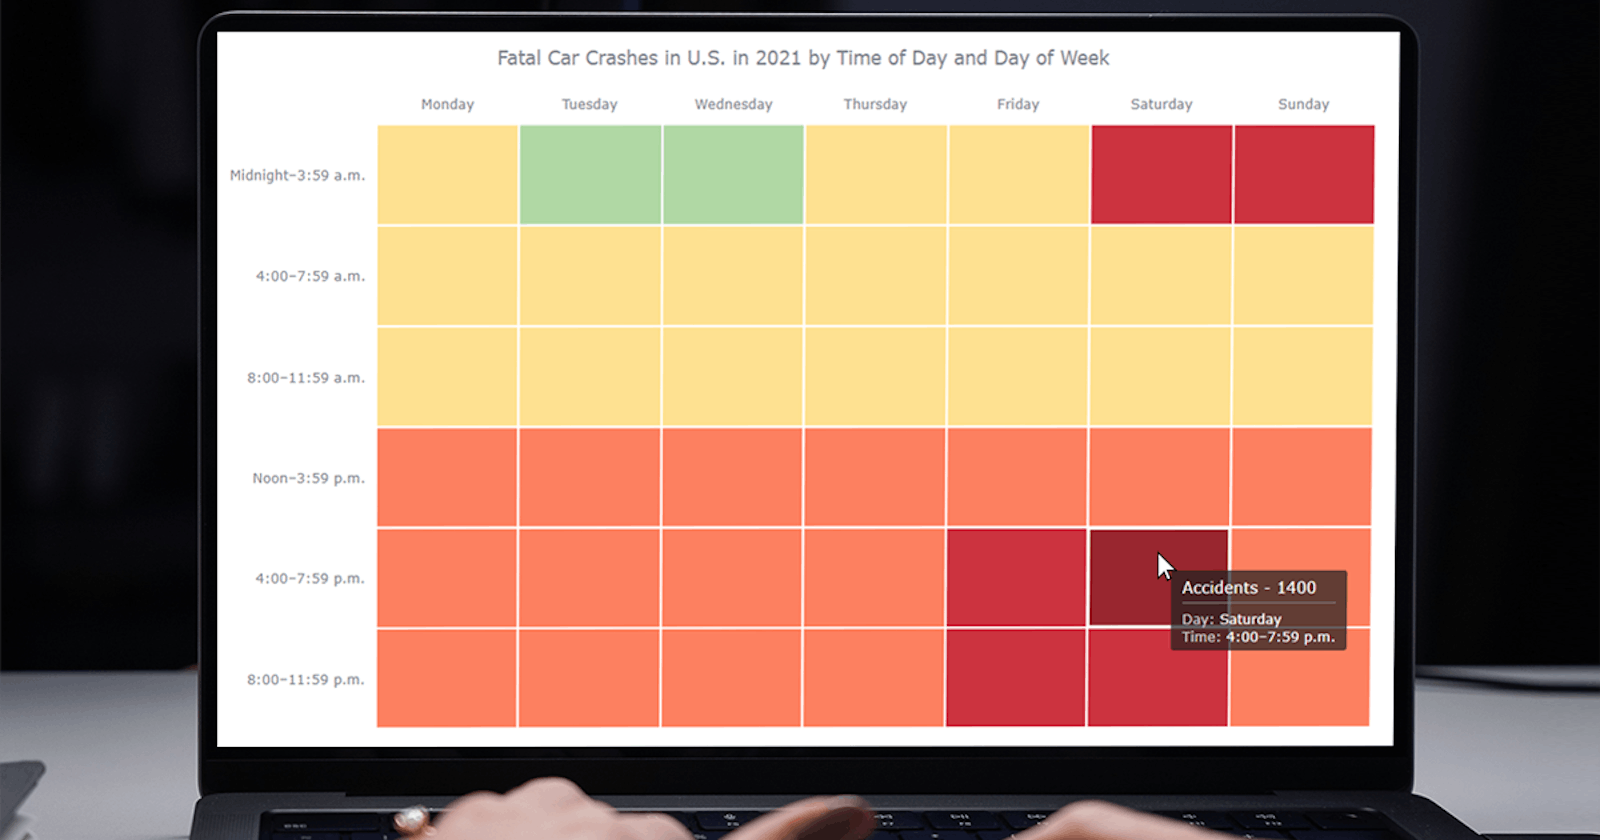
Data visualization is a powerful tool that helps us make sense of complex data. With it, we can spot patterns and trends that might take much more...
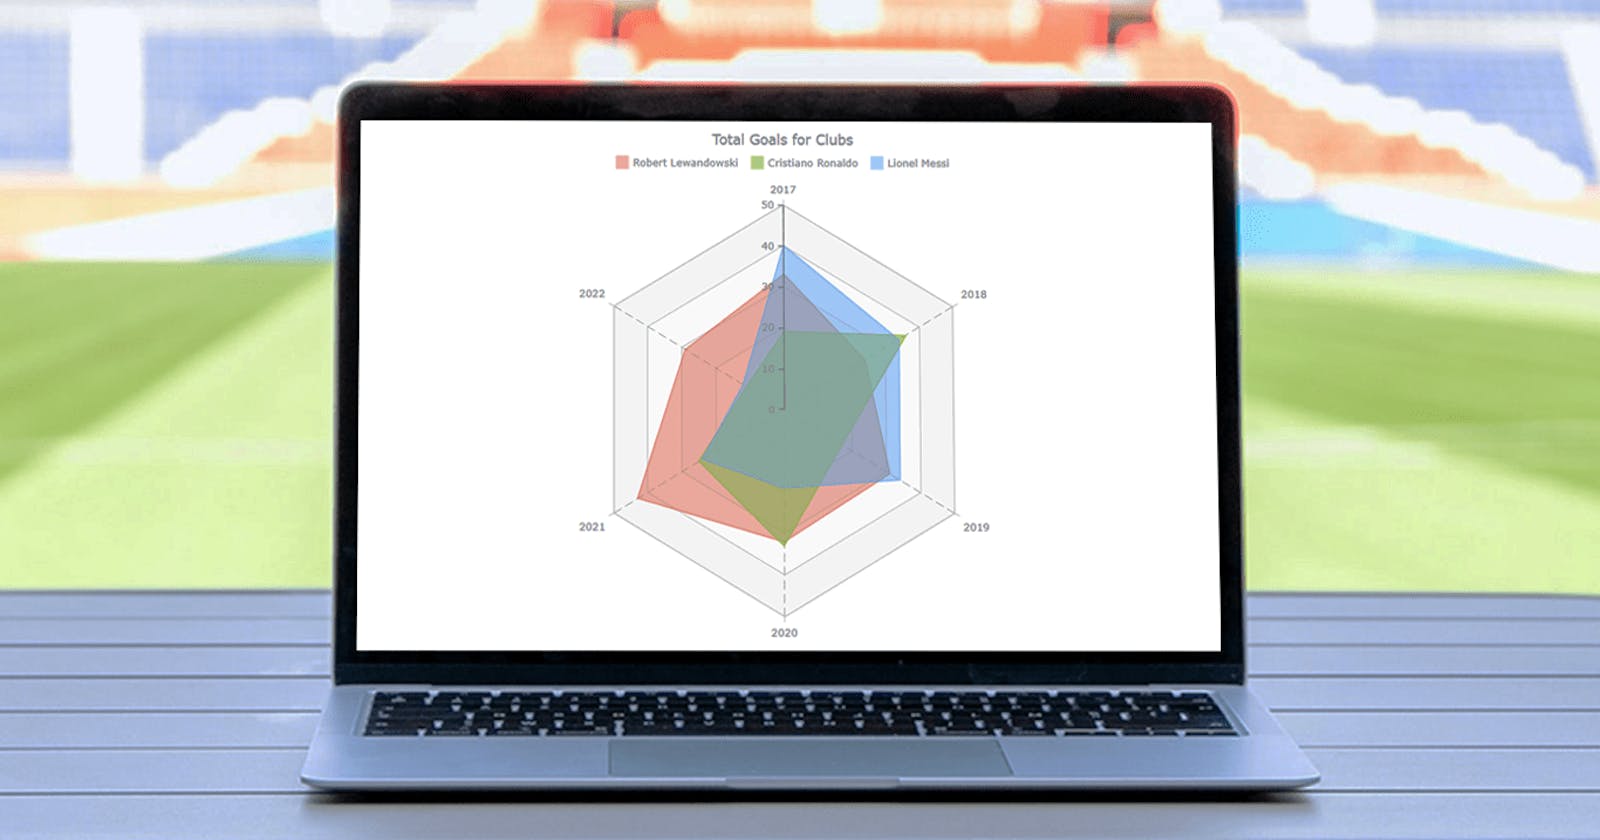
See what a radar chart is and how to easily create it in JS/HTML5. Examples visualize the number of goals scored by Messi, Ronaldo & Lewandowski. · There...