#web-development
Read more stories on Hashnode
Articles with this tag
We are pleased to share a helpful article we've found on EODHD APIs, where Michael Whittle, a seasoned developer and top Medium author, shows how he...
Ever caught yourself thinking about the Roman Empire more often than you’d like to admit? You’re not alone, and we’ve got just the thing for you! With...
The Nobel Prize 2023 announcements are just around the corner, scheduled from October 2 to 9. Recently, I stumbled upon this news, sparking my...
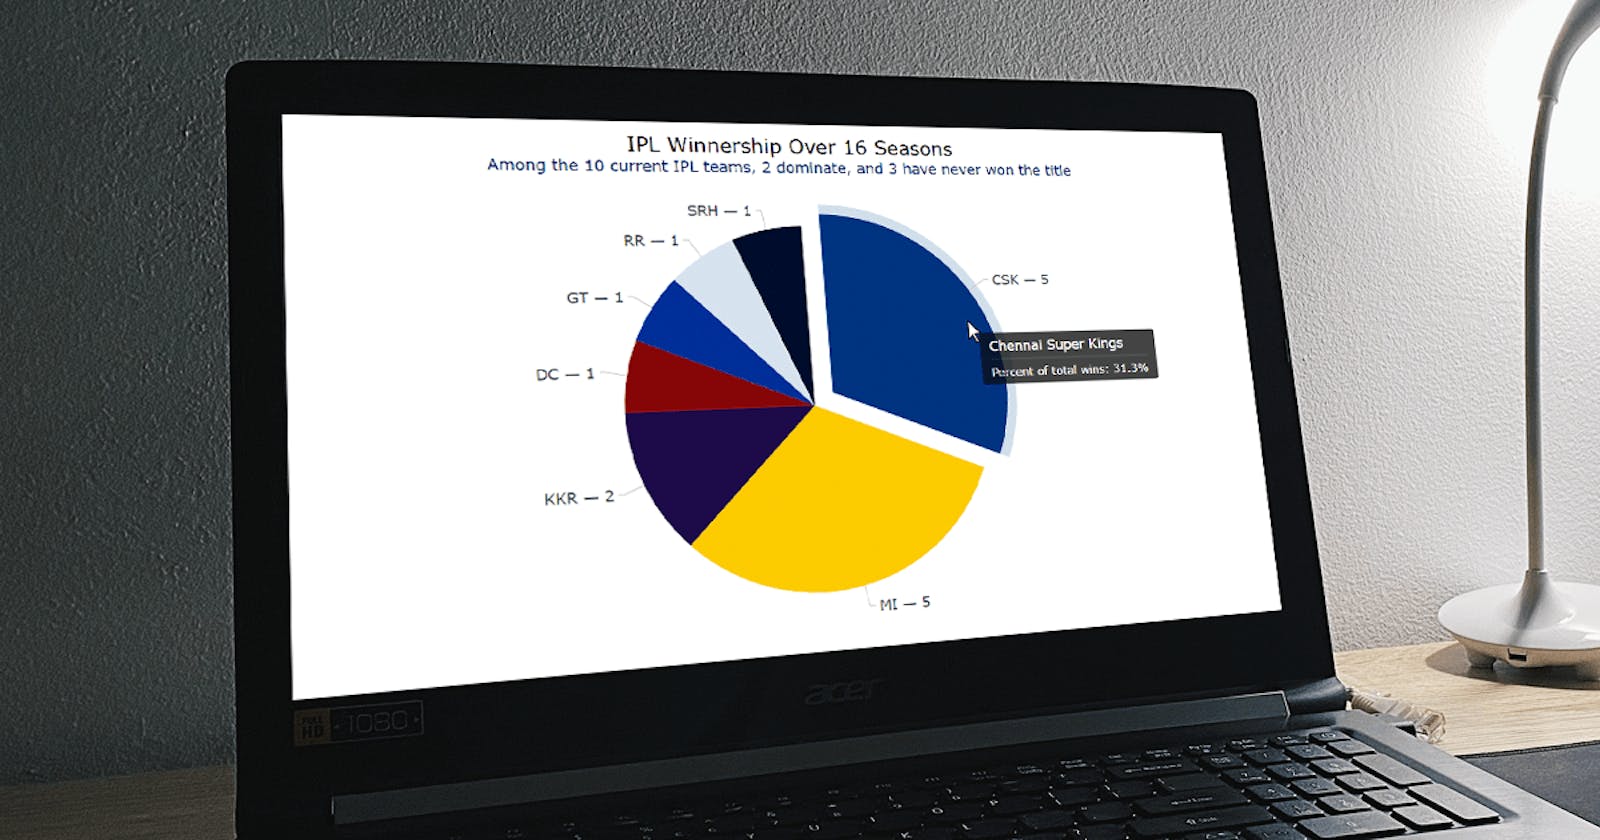
Learn to easily build cool interactive pie charts using JavaScript as we visualize the composition of the IPL winnership over 16 seasons step by step ·...
Visualizing data on the top 30 most-liked YouTube videos · Do you want to turn that data chaos into a comprehensible data show? Look no further than data...
Welcome to this step-by-step tutorial that will empower you to create an interactive Pareto chart using JavaScript that will look nice on any device...