
How to Make a Mosaic Plot in JavaScript
Learn how to create a mosaic plot using JavaScript and explore social media adoption in the U.S. by age.


Have you heard of a mosaic plot? It is a very interesting chart type designed to facilitate exploring relationships between variables. Mosaic plots (also known as mosaic charts) visualize data in rectangular tiles whose width encodes one variable and height the other.
If you’d like to learn how to create such an elegant diagram with ease, follow me as I will show you the ropes right now! Along this tutorial, I will be building an interactive mosaic plot of social media adoption in the United States by age group and year, using JavaScript and explaining every step in detail.
Mosaic Plot to Be Built
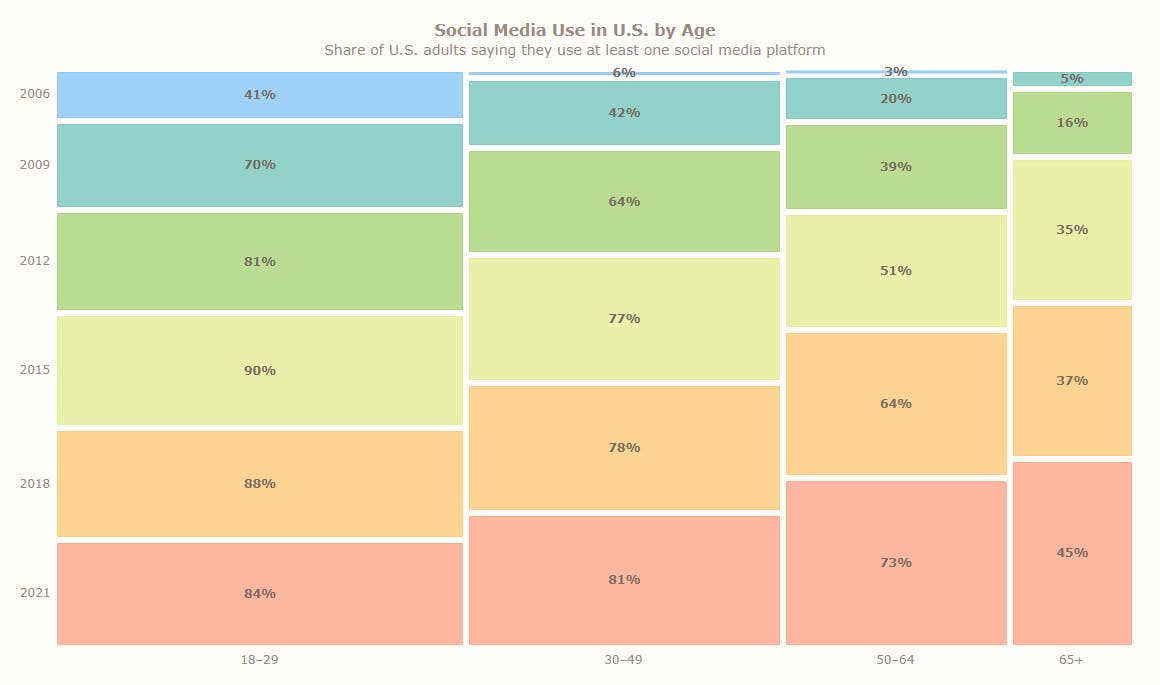
To get you in the mood for some creative work ahead, I invite you to take a sneak peek at the final mosaic plot that will be completed at the end of the article. And it’s time to get the ball rolling!
Basic Mosaic Plot
If you have ever created any charts with JavaScript, you already possess an understanding of how it works. In that case, you simply choose a JS charting library and follow its mosaic plot documentation. But if it is going to be your first such experience (or your previous one was not too easy and exciting), this tutorial is exactly for you!
Let’s begin with defining the steps that should be taken. Generally speaking, literally any cool interactive JS-based data visualization, including a mosaic plot, is built in four fundamental moves:
- Get a web page for your chart to be put on.
- Reference JavaScript files to be used.
- Set data to be visualized.
- Write some JS code for producing the plot you need.
Now, join me as I delve into each!
1. Get a web page
First things first. I create a basic HTML page. In the <body> section, I include a block-level element, <div>, which will be the location where the mosaic plot will be rendered, and provide it with a unique id attribute, container in this case. I also set its height and width settings as 100% as I want to see the mosaic plot stretched along the whole web page.
Here is how my HTML page looks:
<html>
  <head>
    <title>Mosaic Plot in JS</title>
    <style type="text/css">
      html, body, #container {
        width: 100%; height: 100%; margin: 0; padding: 0;
      }
    </style>
  </head>
  <body>
    <div id="container"></div>
  </body>
</html>
2. Reference JavaScript files
Now, it’s time to load scripts that will be used to create the intended mosaic plot on the web page.
Here, I will be using the JS charting library of AnyChart. It’s feature-rich, with comprehensive documentation and API reference, and numerous readymade examples in the gallery. Also, AnyChart is modular, which means one can connect only a couple of lightweight scripts to power the features that are actually needed instead of unnecessarily overloading a web page or app with the whole library.
A mosaic plot requires two modules: Core and Mekko. I add them to the page by including the following in the <head> section:
<script src="https://cdn.anychart.com/releases/8.11.0/js/anychart-core.min.js"></script>
<script src="https://cdn.anychart.com/releases/8.11.0/js/anychart-mekko.min.js"></script>
I also put a <script> tag in the <body> section. (Or it can go to the <head> section. Doesn’t really matter.) That’s where the full JavaScript code of my upcoming mosaic plot will be placed.
Here’s what I’ve got at this point:
<html>
  <head>
    <title>Mosaic Plot in JS</title>
    <script src="https://cdn.anychart.com/releases/8.11.0/js/anychart-core.min.js"></script>
    <script src="https://cdn.anychart.com/releases/8.11.0/js/anychart-mekko.min.js"></script>
    <style type="text/css">
      html, body, #container {
        width: 100%; height: 100%; margin: 0; padding: 0;
      }
    </style>
  </head>
  <body>
    <div id="container"></div>
    <script>
      // The JS mosaic plotting code will come here.
    </script>
  </body>
</html>
3. Set data
Then comes data. As I pointed out in the introduction, I want to look at social media adoption in the U.S. Nowadays, about three-quarters of all American adults are reported to use at least one social media site. Let’s take a deeper dive and explore the situation across different age groups and years — it’s going to be a cool example of a mosaic plot in action!
The data I will be visualizing is from Pew Research Center. It does not look complicated, so I will add it directly to the code. Pay attention to the format of the data because that’s how the mosaic plot “understands” what to represent on which axis.
let data = {
  header: ['#', '2006', '2009', '2012', '2015', '2018', '2021'],
  rows: [
    ['18–29', 41, 70, 81, 90, 88, 84],
    ['30–49', 6, 42, 64, 77, 78, 81],
    ['50–64', 3, 20, 39, 51, 64, 73],
    ['65+', 0, 5, 16, 35, 37, 45]
  ]
};
4. Write some JS code
I’ve got a place for my mosaic plot, scripts to draw it, and data that needs to be visualized. Now that those things are all set, I will do some quick JavaScript coding within the <script> tag.
The very first thing I do here is add the anychart.onDocumentReady() function. Everything else will go inside of it and will be executed after the web page is fully loaded.
<script>
  anychart.onDocumentReady(function () {
    // The JS mosaic plotting code will come here.
  });
</script>
Then I add the data from the previous step:
anychart.onDocumentReady(function () {

  let data = {
    header: ['#', '2006', '2009', '2012', '2015', '2018', '2021'],
    rows: [
      ['18–29', 41, 70, 81, 90, 88, 84],
      ['30–49', 6, 42, 64, 77, 78, 81],
      ['50–64', 3, 20, 39, 51, 64, 73],
      ['65+', 0, 5, 16, 35, 37, 45]
    ]
  };

});
Then, inside the same function, I create an instance of a mosaic plot:
let chart = anychart.mosaic();
And load the data to it:
chart.data(data);
I also add a title for the entire mosaic plot:
chart.title("Social Media Use in U.S. by Age");
Finally, I define where to put the visualization by specifying the ID of the <div> element (see step 1) and draw the resulting mosaic plot.
chart.container('container');
chart.draw();
Here is how the entire JavaScript code of my mosaic plot looks:
anychart.onDocumentReady(function () {

  // set the data to visualize
  let data = {
    header: ['#', '2006', '2009', '2012', '2015', '2018', '2021'],
    rows: [
      ['18–29', 41, 70, 81, 90, 88, 84],
      ['30–49', 6, 42, 64, 77, 78, 81],
      ['50–64', 3, 20, 39, 51, 64, 73],
      ['65+', 0, 5, 16, 35, 37, 45]
    ]
  };

  // create a mosaic plot
  let chart = anychart.mosaic();

  // load the data to the plot
  chart.data(data);

  // set the plot title
  chart.title("Social Media Use in U.S. by Age");

  // set the mosaic chart container element id
  chart.container('container');

  // draw the resulting chart
  chart.draw();

});
Bingo! A basic mosaic plot is ready in that few lines of code!
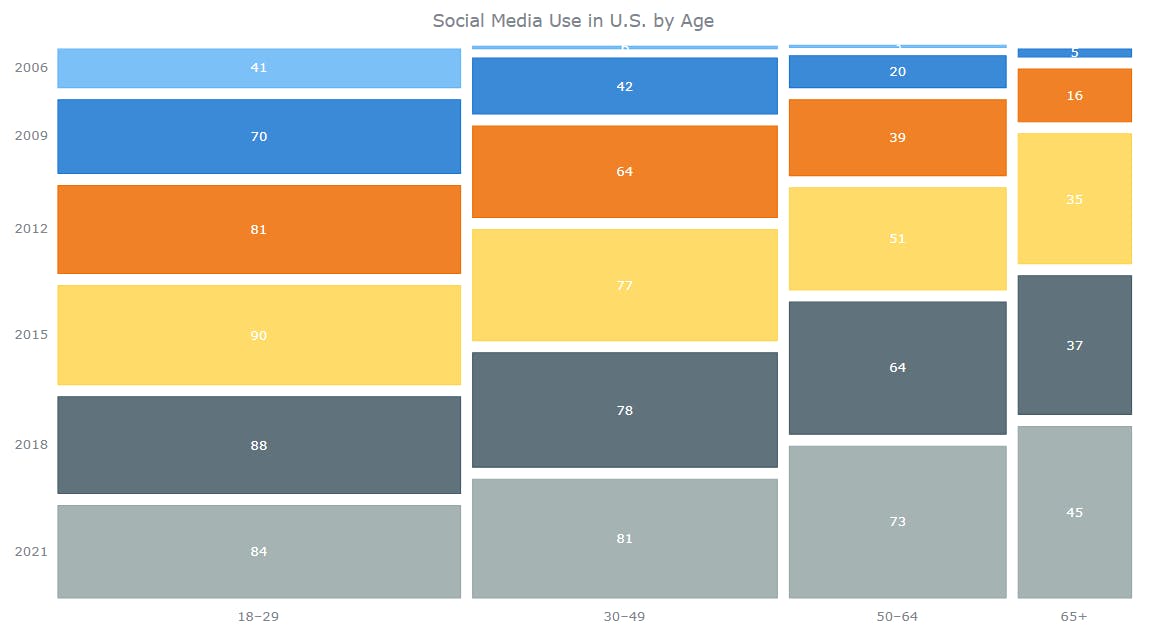
We can immediately see that a higher percentage of people in the youngest age group use social media than in any other. Well, one could expect it. But look at how much more people in the other age groups use social media now compared to 10 or 15 years ago. See what else you can notice.
Check out this basic mosaic plot on AnyChart Playground. Just in case, the full code is also right below:
<html>
  <head>
    <title>Mosaic Plot in JS</title>
    <script src="https://cdn.anychart.com/releases/8.11.0/js/anychart-core.min.js"></script>
    <script src="https://cdn.anychart.com/releases/8.11.0/js/anychart-mekko.min.js"></script>
    <style type="text/css">
      html, body, #container {
        width: 100%; height: 100%; margin: 0; padding: 0;
      }
    </style>
  </head>
  <body>
    <div id="container"></div>
    <script>

      anychart.onDocumentReady(function () {

        // set the data to visualize
        let data = {
          header: ['#', '2006', '2009', '2012', '2015', '2018', '2021'],
          rows: [
            ['18–29', 41, 70, 81, 90, 88, 84],
            ['30–49', 6, 42, 64, 77, 78, 81],
            ['50–64', 3, 20, 39, 51, 64, 73],
            ['65+', 0, 5, 16, 35, 37, 45]
          ]
        };

        // create a mosaic plot
        let chart = anychart.mosaic();

        // load the data to the plot
        chart.data(data);

        // set the plot title
        chart.title("Social Media Use in U.S. by Age");

        // set the mosaic chart container element id
        chart.container('container');

        // draw the resulting chart
        chart.draw();

      });

    </script>
  </body>
</html>
Advanced Mosaic Plot
The mosaic plot built in the previous part of the tutorial is based on the default settings for this chart type configured in the AnyChart JS charting library. But there are also various options to tweak the visualization. Now, come along as I harness the power of customization to make my mosaic plot more stylish and informative.
- Change the chart design theme.
- Enhance the labels.
- Adjust the tile spacing.
- Improve the title.
- Enhance the tooltip.
FOR A WALKTHROUGH OF THESE JS MOSAIC PLOT CUSTOMIZATIONS, CONTINUE READING HERE.